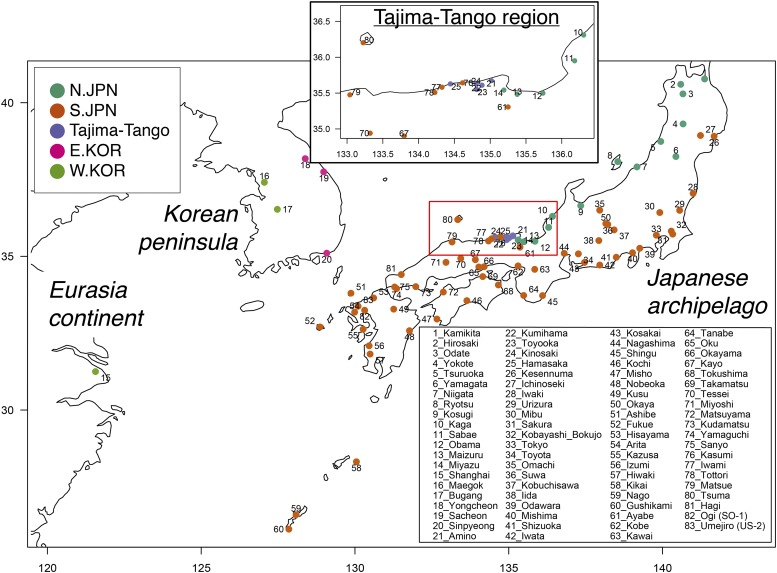
Figure 1.
Map of the original locations of the wild lab stocks and wild-captured medakas. In the upper central map, the enlarged red frame shows the boundary region between S.JPN and N.JPN. Each color represents the mtDNA and allozyme-based groups shown in the left upper inset box. The numbers on the map are consistent with the population IDs, with the names on the right bottom inset box.

