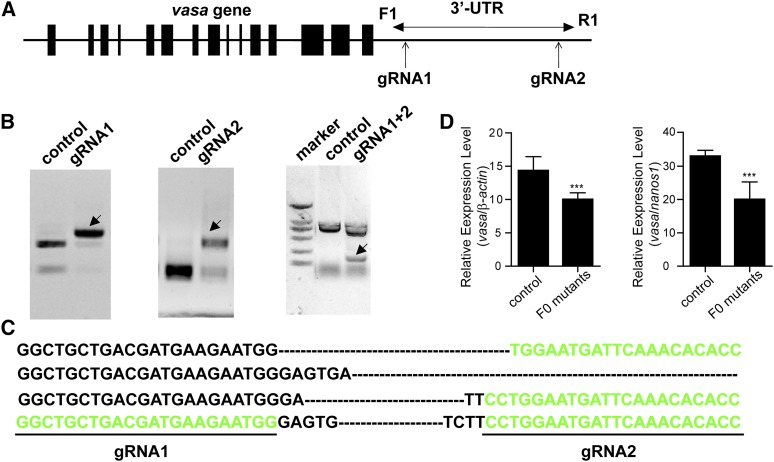
Figure 4.
Deletion of 3′-untranslated region (UTR) using one pairs of gRNAs and ssDNA. (A) Two gRNAs was designed in the 3′-UTR of vasa. (B) PCR amplification of genomic DNA extracted from the injected and control embryos indicated successful deletion of the 3′-UTR region. (C) Sequencing of the PCR products further confirmed the deletions (indicated by arrow). Deletions are marked by dashes WT, wild type. (D) The vasa mRNA expression level obtained by real-time PCR was significantly decreased in the F0 mutants when compared with the control group. β-actin and germ cell marker nanos1 were used as the internal control. The relative abundance of vasa mRNA transcripts was evaluated using the formula: R= 2-△△Ct. Data are presented as the means± SD of the triplicates. ***P < 0.01 compared with the control using one-way ANOVA.

