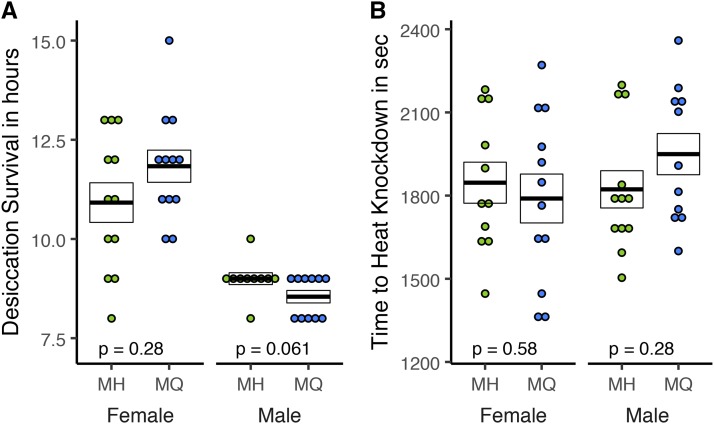
Figure 6.
Desiccation and heat shock resistance were measured for adult female and male flies. For desiccation resistance (A) each data point represents the time in hours until death. For heat shock resistance (B), each data point represents the mean time in hours until death of all individuals in a vial. For both traits, sample sizes are 10 ≤ n ≤12, crossbars represent mean ± SE and p-values correspond to a Wilcoxon test on MH vs. MQ for each sex.

