Figure 3.
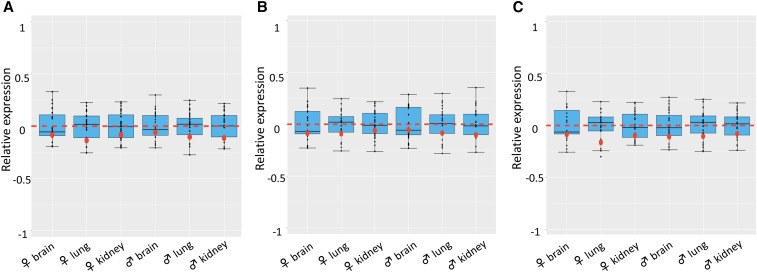
Boxplots of log2-transformed expression of the X chromosome (RXE) and each autosome pair by fetal tissues from mothers under different nutritional treatments: Control (A), Overfed (B) and Restricted (C). Red dots: RXEs for all replicates within a treatment group. Black dots: RGEs for each autosome pair. Numbers by black dots: autosomes whose RGEs fell outside of the expression quartiles for the tissue. Red dotted line: the border for complete (above line) and incomplete (below line) dosage compensation. The X:A ratio was calculated as the Relative X expression, RXE = log2 (X) − log2 (A), the difference between the log2-transformed mean TPM values of X and A. An RXE value of 0 means the expression of X and autosome is equal, suggesting X dosage compensation. Positive and negative RXE values indicate complete and incomplete dosage compensation, respectively. An RXE of -1, however, represents the lack of X dosage compensation. RGE of each autosome pair over all other chromosomes was used to evaluate the deviation of X expression to autosomes.

