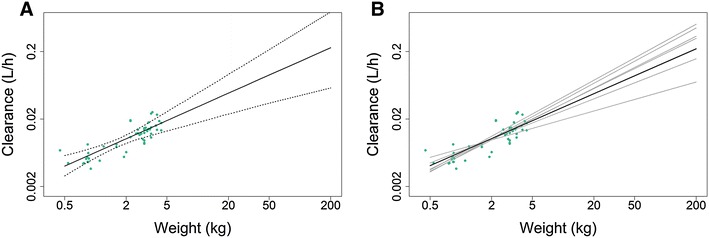
Fig. 1.

Clearance predictions versus weight (0.5–200 kg) in an example neonatal dataset. (a) Median (solid black line) and 95% confidence interval (dotted line) of 1000 functions of CLTV versus weight obtained from 1000 bootstrap runs; green dots represent the individual post hoc CLi estimates of the studied patients. (b) Estimated function of CLTV versus weight from the original dataset (solid black line) and illustrative set of functions of CLTV versus weight (grey solid lines) obtained in six (of 1000) separate bootstrap runs; green dots represent the individual post hoc CLi estimates of patients in the original dataset. Depicted results were obtained using a normalization weight of 2.7 kg. CLTV clearance for a typical individual, CLi clearance for individual i
