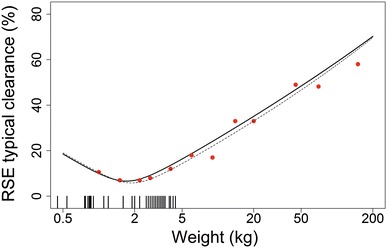
Fig. 2.

Relation between weight and the RSE of both CLTV and CLpop in an illustrative neonatal dataset. The solid line represents the RSE of CLTV predictions from 1000 bootstrap runs, the dotted line represents the RSE of CLTV predictions obtained from the variance–covariance matrix (Eq. 5), and the red dots represent the RSE of the estimated CLpop parameter using the corresponding normalization weight, obtained from the covariance step of a single NONMEM run. The vertical tick marks on the bottom of the graph depict the body weights of subjects in the dataset. RSE relative standard error, CLTV clearance for a typical individual, CLpop population clearance
