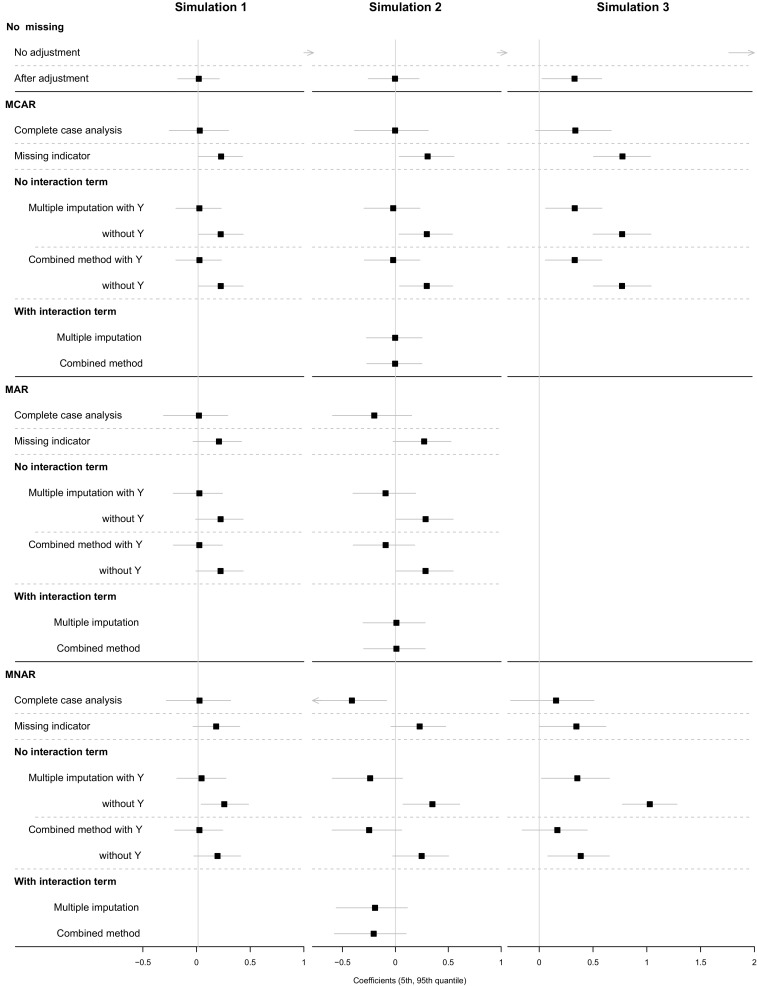
Fig. 4.

Mean treatment effects and their 5th and 95th percentile ranges estimated by propensity weighting in Simulation setting 1 (left), 2 (middle) and 3 (right). For each missing scenario, missing data are handled with complete case analysis, missing indicator method, multiple imputation, and the combination of multiple imputation and missing indicator method (Combined method). The vertical lines represent the true treatment effect
