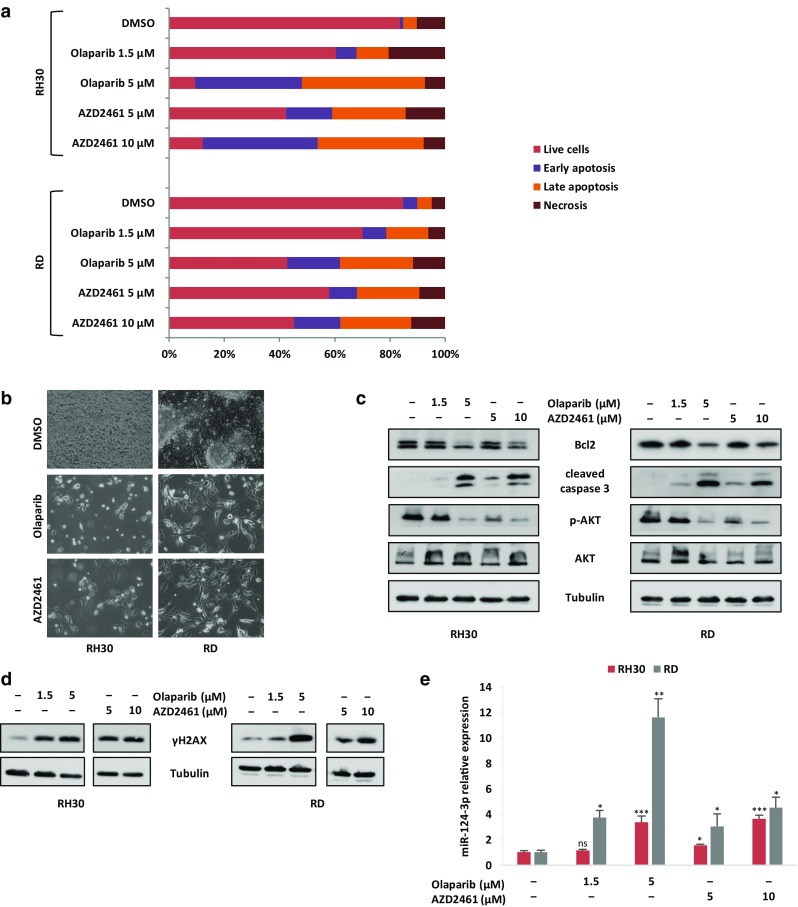
Fig. 4.

Effects of Olaparib and AZD2461 treatment on apoptosis in RMS cell lines. a Histograms show the rate of apoptosis in RMS cells 144 h after PAPRi treatment (1.5 and 5 µM Olaparib or 5 and 10 µM AZD2461). Cells were stained with Annexin V and 7-AAD and then analysed by flow cytometry. Data are expressed as a percentage of total cell number. b Images showing morphological changes observed in both RH30 and RD cells analysed under light microscope at 20x magnification at 144 h after 5 µM Olaparib or 10 µM AZD2461 treatment. Unlike mocked controls, RMS treated-cells exhibited a wide number of vacuoles and cytoplasm destruction. c Western blots showing the expression of the apoptosis related proteins, Bcl2, cleaved caspase-3, p-AKT (Ser473) and AKT in RH30 and RD cells after prolonged treatment with Olaparib or AZD2461. Tubulin expression was used as internal control. Representative blots of three independent experiments. d Expression levels of phospho-H2AX (γH2AX) analysed by western blotting experiments in RH30 and RD cells treated with Olaparib (1.5 and 5 µM) or AZD2461 (5 and 10 µM) for 144 h compared to mocked control cells (DMSO). Tubulin expression was used as loading control. Representative blots of two independent experiments. e q-PCR analysis of miR-124-3p mRNA levels in RH30 and RD cells treated with increasing concentration of Olaparib or AZD2461 for 144 h. The results are expressed as fold increase over relative mocked controls (DMSO), arbitrarily set at 1. Transcript levels were normalized to U6 mRNA and error bars represent SD of two independent q-PCR reactions, each performed in triplicate. Statistical significance: *, p < 0.05, **, p < 0.01, ***, p < 0.005, ns not significant vs. DMSO mocked controls
