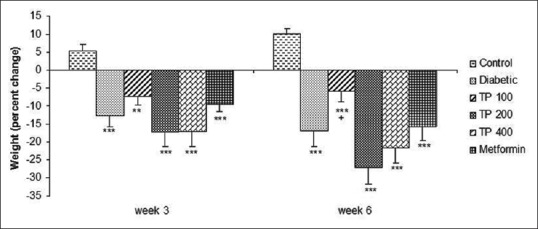
Figure 1.

Percent weight changes in control, diabetic, diabetic-metformin, and Teucrium polium extract (TP 100, TP 200, TP 400)-treated groups. **P < 0.01, ***P < 0.001 versus control group and + P < 0.05 versus diabetic group. Statistical analyses were made using the one-way ANOVA followed by the Tukey's test. TP: Teucrium polium
