Figure 1.

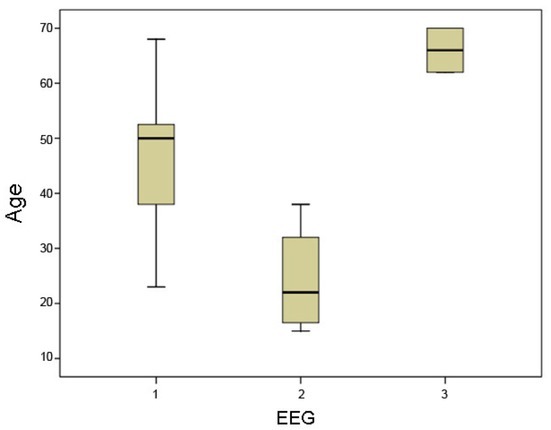
Age distribution in patients with normal EEG (1) vs. patients with mild EEG abnormalities (2) vs. patients with moderate EEG abnormalities (3). The overall difference between the three EEG groups is highly significant (P = 0.005).

Age distribution in patients with normal EEG (1) vs. patients with mild EEG abnormalities (2) vs. patients with moderate EEG abnormalities (3). The overall difference between the three EEG groups is highly significant (P = 0.005).