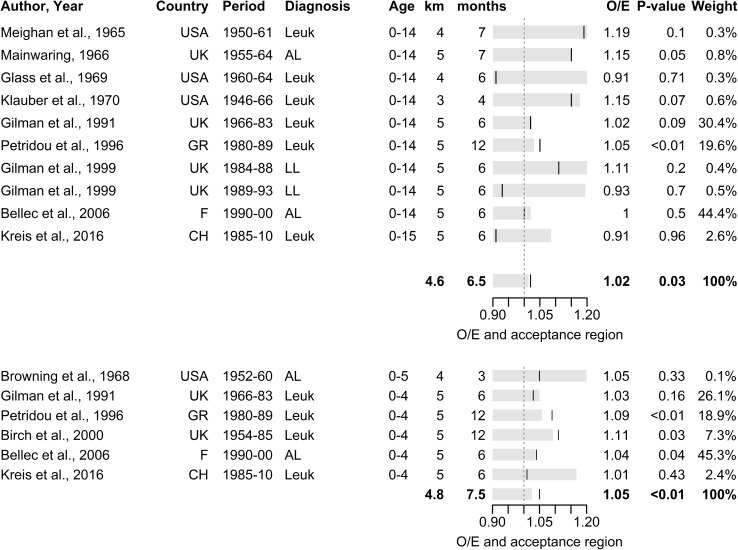
Fig. 3.
Pooled analysis of space–time clustering studies of childhood leukaemia for place and time of diagnosis for children aged 0–15 years (top) and 0–5 years (bottom) for spatial lags of 3–7 km and temporal lags of 0–12 months: forrest plot of ratio of observed over expected number of close pairs of cases (O/E) and acceptance region for one-sided Knox test at 5% alpha-level assuming Poisson distribution

