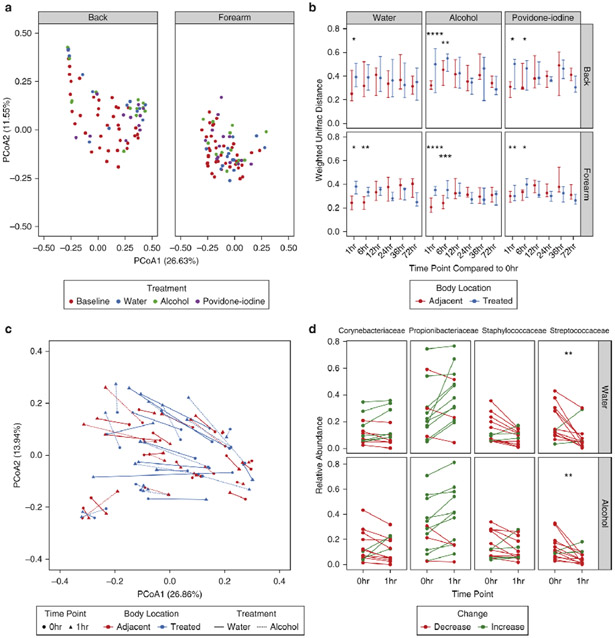
Fig. 2.
Treatment elicits personalized shifts in weighted comparisons of skin bacterial populations. (A) Principal coordinates analysis of weighted UniFrac distances for treated body sites at baseline and 1hr post-treatment. Each point represents a single sample, colored by treatment and shaped by body site. (B) Weighted UniFrac distances of subjects’ longitudinal time points compared to their individual baseline communities at treated and adjacent body sites. Points represent the median of participants. Error bars designate interquartile regions. (C) Subanalysis of weighted UniFrac distances visualized by principal coordinates analysis in subjects treated with water and alcohol at the forearm. Lines connect baseline and 1hr post-treatment samples for individual subjects, and line types designate treatment regimen. Line colors refer to treated body sites or their respective adjacent controls. (D) Comparison of relative abundances for the top 4 taxa at baseline and 1hr post-treatment with water or alcohol. Each line represents an individual subject colored by an increase or decrease in relative abundance following treatment. * P < 0.05, ** P < 0.01 by Wilcoxon rank sum test (Mann-Whitney U test).

