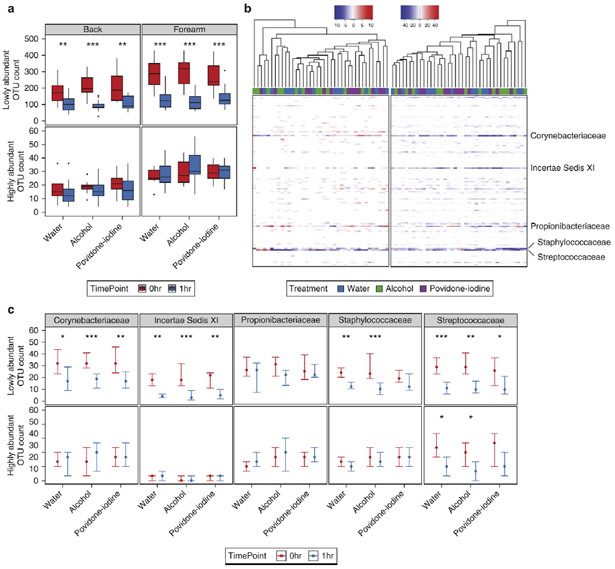
Fig. 6.
Lowly abundant members of prominent taxa are the greatest contributors to treatment effects at the skin surface. (A) Box and whisker plots of lowly and highly abundant OTU counts as defined by a 0.5% relative abundance threshold following treatment at the forearm and back. (B) Heat map of differences in forearm OTU counts between baseline and 1hr post treatment with water and antiseptics. Each column represents the difference measured for a single subject and treatment, and each row represents a bacterial family. Samples are clustered by the Unweighted Pair Group Method with Arithmetic means (UPGMA). Color-coded bars above the graph designate treatments for each sample. (C) Comparison of lowly and highly abundant OTU counts at the forearm in major taxonomic families at baseline and 1hr post-treatment. Points represent the median of the study cohort. Error bars designate interquartile regions. * P < 0.05, ** P < 0.01, *** P < 0.001 by Wilcoxon rank sum test (Mann-Whitney U test).

