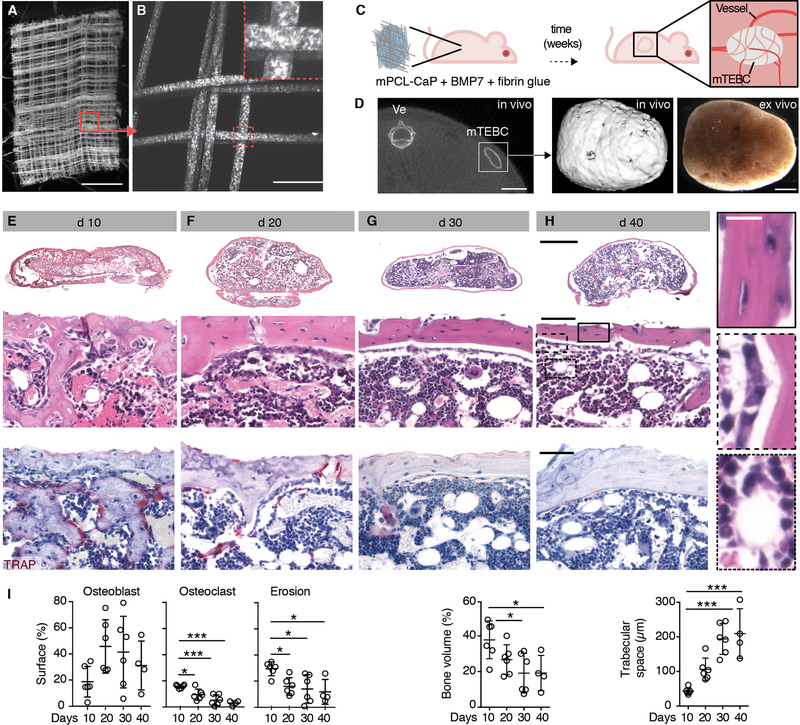
Fig. 1. Generation and characterization of a tissue-engineered ossicle in vivo.
(A) Macroscopic overview of melt electrospun mPCL-CaP scaffold by bright-field microscopy. Box, magnification shown in (B). Bar, 1 mm. (B) Maximum intensity projection of mPCL-CaP scaffold by multiphoton-excited second harmonic generation (SHG) detection (z-depth 100 μm). Box, magnification. Bar, 100 μm. (C) Schematic representation of the model. Nude mice were implanted subcutaneously with an mPCL-CaP scaffold embedded in fibrin glue and BMP7 (10 μg/mouse) that generated a mature, vascularized ossicle over time. (D) Localization of the ossicle (mTEBC) by μCT at day 30. Ve, vertebra; box, representative 3D reconstruction and bright field image shown on the right. Bars, 5 and 1 mm, respectively. (E-H) Histological overview, cortical detail and TRAP staining showing mTEBC maturation over time (E, d 10; F, d 20; G, d 30; H, d 40; d, day after implantation). Bars 1 mm (overviews) and 100 μm (zooms). Insets show higher magnifications of boxed regions in (H). Bar, 25 μm. (I) Quantification by bone histomorphometry. Parameters analyzed: osteoblast surface (% of total bone surface; Ob. S/BS %); osteoclast surface (% of total bone surface; Oc. S/BS, %); erosion surface (% of total bone surface; ES/BS, %); bone volume (% of tissue volume; BV/TV, %); and trabecular separation (Tb. Sp.). Mean ± SD is shown, n=4–6/group. Bone cortex measurements, 5 cortical areas/mTEBC, 350 × 150 μm each; medullary region measurements, 4 areas/mTEBC, 250 × 250 μm each. *P < 0.05; *** P <0.001 by one-way ANOVA followed by Tukey’s HSD post-hoc test.

