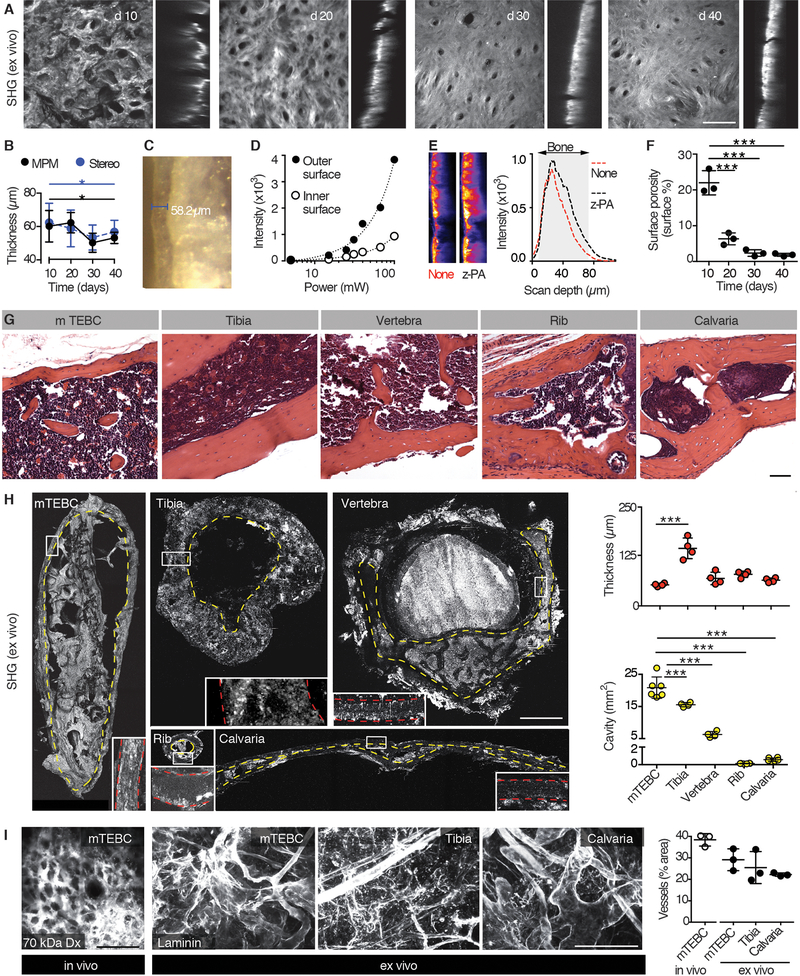
Fig. 2. Analysis of the mTEBC morphology.
(A) Maximum intensity projection of the SHG signal to detect the cortical bone of the ossicle ex vivo at days 10, 20, 30 and 40. Horizontal (xy, left) and orthogonal view (xz, right) are shown (z-depth, 150 μm). Bar, 100 μm. (B, C) Quantification of cortical bone thickness by MPM or stereomicroscope (image in C). Mean ± SD, 6 areas/mTEBC were averaged, 3 ossicles from independent mice per time point. (D) Measurement of the signal intensity in dependence of the laser power at the outer and inner cortical bone surface. Scanning wavelength, 1090 nm. One representative out of two independent experiment is shown. (E) Z-power adaptation. Representative orthogonal view (xz) images of increased intensity and signal distribution are shown. Scanning wavelength, 1090 nm. (F) Quantification of surface porosity, represented as mean ± SD; individual data points are shown (6 areas/mTEBC were averaged, 3 ossicles from independent mouse per time point). (G) Histology (H&E) of the ossicle compared to the mouse tibia, vertebra, rib and calvaria. Bar, 50 μm. (H). 3D SHG reconstruction of the indicated bones (z-depth of specimen: TEBC, 1 mm; tibia, 800 μm; vertebra, 1 mm; rib, 400 μm; calvaria, 800 μm). Yellow dotted line, cavity. Box, magnification of cortical bone. Red dotted line, cortical bone. Data represent the mean ± SD, n=4–6 independent samples. (I) Left panel: intravital detection of blood vessels in the mTEBC (70 kDa AlexaFluor-750-conjugated Dextran, dx). Central and right panels: MPM detection of blood vessels (laminin) in cleared mTEBC, tibia, and calvaria ex vivo. Right panel: quantification (mean ± SD, n=3). Bar, 100 μm. *P < 0.05; *** P <0.001 by one-way ANOVA followed by Tukey’s HSD post-hoc test.

