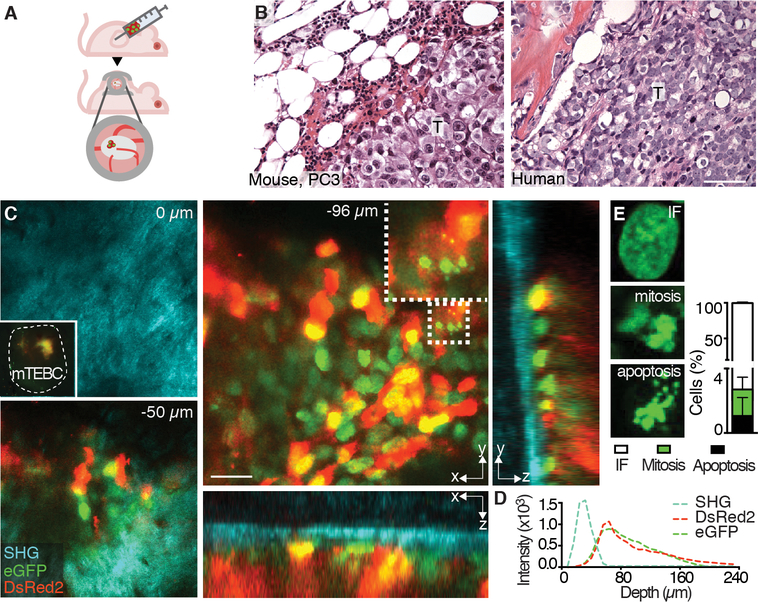
Fig. 3. PC3 tumor cell administration and monitoring by histology and iMPM.
(A) Schematic representation of the model. PC3 cells were injected into the mature ossicle 30 days after implantation into nude mice. A dorsal skin-fold chamber was applied 10–14 days post-tumor cell implantation, adjacent to the ossicle to enable iMPM. (B) Histology of PC3 cells in mTEBC and patient biopsy. T, tumor. Bar, 100 μm. (C) iMPM detection of PC3 cells at different scanning depths (z-stack at z=0, −50 and −96 μm). Overviews shown as xy and xz, yz orthogonal sections and detail with subcellular resolution (dotted box). Dashed line in top left panel denoted the edge of the ossicle with fluorescence signal originating from the tumor. (D) Xz intensity profile of individual channels with increasing scanning depth into the ossicle. (E) Quantification of interphase (IF), mitotic, or apoptotic cells in 3D stacks captured by iMPM. Mean ± SD is shown, n=5 independent lesions. Nucleus = H2B/eGFP, green; cytoplasm = DsRed2, red; collagen fibers, bone = SHG, cyan. Bar, 100 μm.

