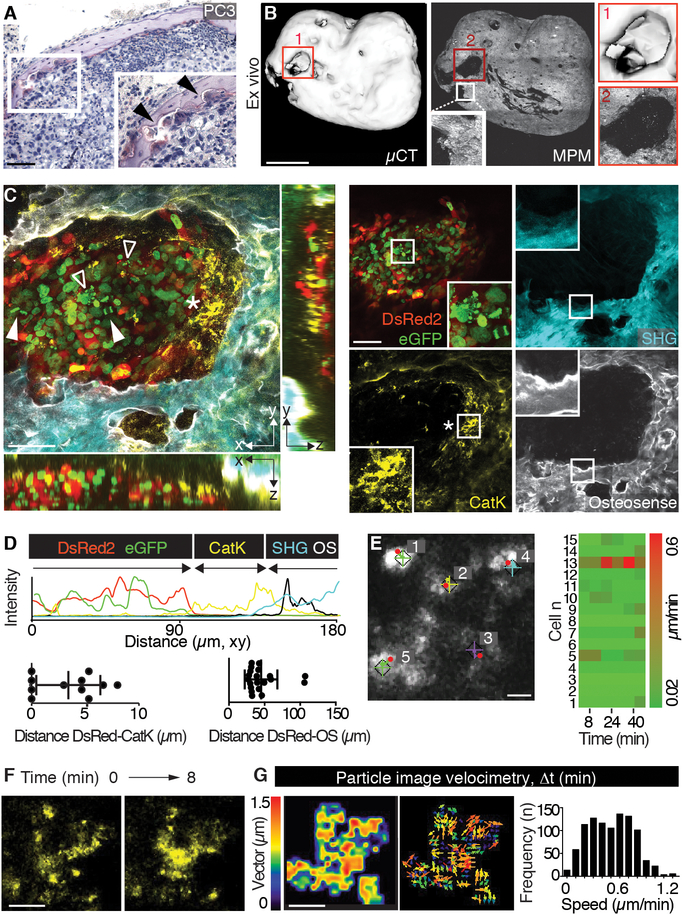
Fig. 4. Monitoring of osteolysis and dynamics of cathepsin K+ cells.
(A) TRAP staining of PC3 lesion in mTEBC. Box, inset (magnification). Arrowheads indicate osteoclasts. Bar, 100 μm. (B) Evaluation of osteolysis by ex vivo μCT and SHG detection by MPM. Magnifications of numbered boxed regions are shown. Bar, 1 mm. (C) iMPM detection of an osteolytic lesion. Merged xy and xz, yz orthogonal views, single channels and details are shown. Box, magnification. Nucleus = H2B/eGFP, green; cytoplasm = DsRed2, red; collagen fibers, bone = SHG, cyan; bone remodeling = OS, white; osteoclast/phagocyte = cathepsin K (Cat K), yellow. Solid arrowhead, mitotic event; void arrowhead, apoptotic nucleus; asterisk, Cat K+ cells. Bar, 100 μm. (D) Imaging analysis, xy intensity profile for single channels and quantification of the distance between tumor border (first layer of cells, DsRed2) and osteoclast/phagocyte (Cat K) or bone (OS). Scatter diagrams represent measurements from different regions in 3 independent lesions. (E) Dynamics of Cat K+ events monitored by time-lapse iMPM and analyzed by tracking. “+” and diamonds indicate the start and red dots the final position of each cell, numbers indicate individual cells. Right panel, heatmap of the speed of 15 representative cells. Bar, 20 μm. (F, G) Cat K signal detected over time by time lapse iMPM (F) and particle imaging velocimetry (PIV) obtained by whole-field analysis (G). Two sequential frames obtained at different time points (0 and 8 min) from movie S2 are shown. Bar, 10 μm. Magnitude, vector map and speed frequency distribution (3–4 areas/tumor, from 3 mice).

