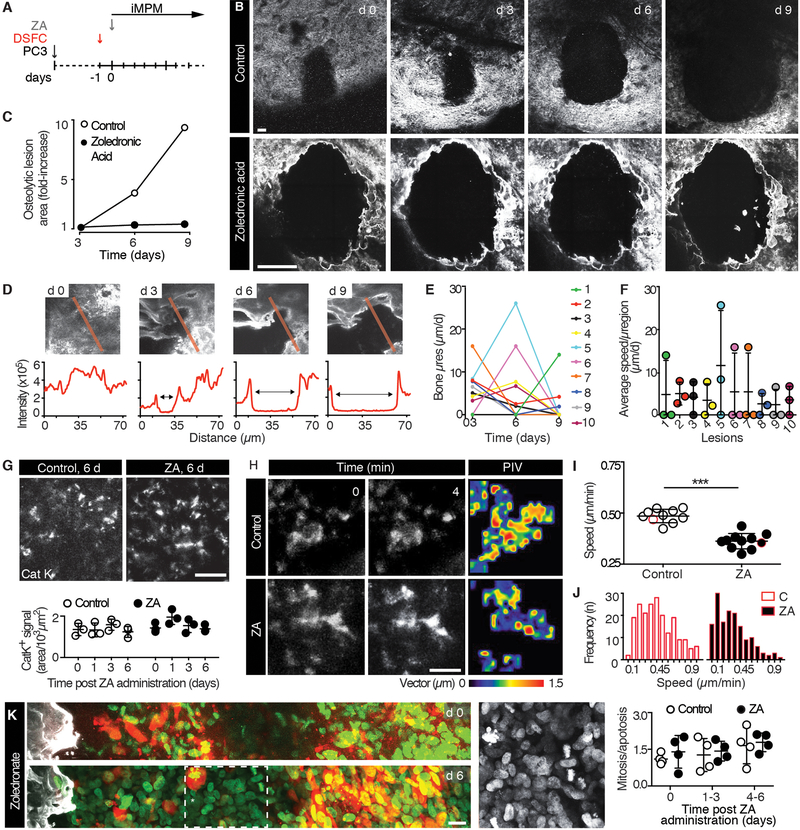
Fig. 5. Response to zoledronic acid therapy monitored by iMPM.
(A) Schematic representation of the experimental schedule. 10–14 days after PC3 cells injection, mice were implanted with a DSFC and treated with zoledronic acid (ZA; 20 μg/mouse in saline by a single intravenous injection) the subsequent day. (B, C) Longitudinal monitoring of osteolytic progression by SHG detection at iMPM in control (vehicle, saline) and zoledronic acid treated mice and quantification of the resorbed area of lesions represented in (B). Bar, 100 μm. Note the different scale of the images representing control and zoledronic acid treated tumors to accommodate the different size of the osteolytic region. (D) Imaging analysis of micro-osteolytic lesion progression in ZA treated mice. (E, F) Quantification of the μspeed of bone resorption in individual subregions (E) and corresponding average μspeed/subregion over time representing the changes from days 0–9 (F). Data show the mean ± SD; n=10 microregions from 3 independent osteolytic lesions. (G) Density of Cat K signal over time. Mean ± SD, n=3 independent lesions/time point. Bar, 100 μm. No significant difference was identified by one-way ANOVA followed by Tukey’s HSD post-hoc test. (H) PIV analysis of Cat K signal in control and ZA treated mice; 2 representative frames and magnitude map. Bar, 20 μm. Area, 65 × 65 μm. (I, J) Average speed in control and ZA treated mice. Mean ± SD. For image analysis, the quantification of PIV was obtained from 3–4 areas/lesion, from 4 mice/group. Speed distribution obtained from representative cells highlighted by red-outline in panel (I). *** P <0.001 by Student t-test, unpaired, two-tailed. (K) PC3 cell replicative status. Representative images taken at the onset and 6 d after ZA application (left panels) and quantification of the ratio between mitotic and apoptotic cells at different time points (right diagram); mean ± SD, n=4 independent lesions/time point. Bar, 10 μm. No significant difference was identified by one-way ANOVA followed by Tukey’s HSD post-hoc test.

