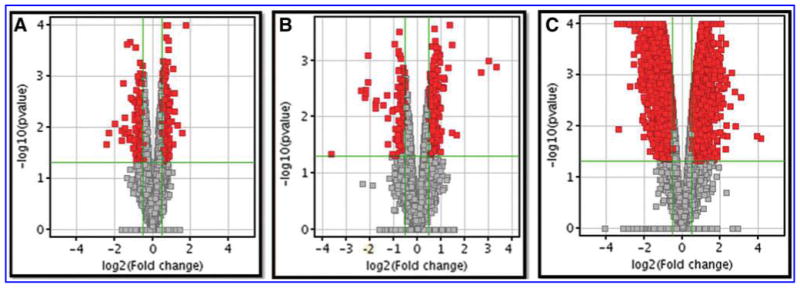
FIG. 1.

Selection of differentially expressed genes of ELT (A) Dam lung tissue (B) and Offspring lung tissue (C). Volcano plot of differentially expressed genes between ELT and Dam and Offspring tissues exposed to MCS and filtered air. The vertical lines correspond to 1.4-fold up and down expression and the horizontal line represents a p-value of 0.05. ELT, EpiAirway lung tissue.
