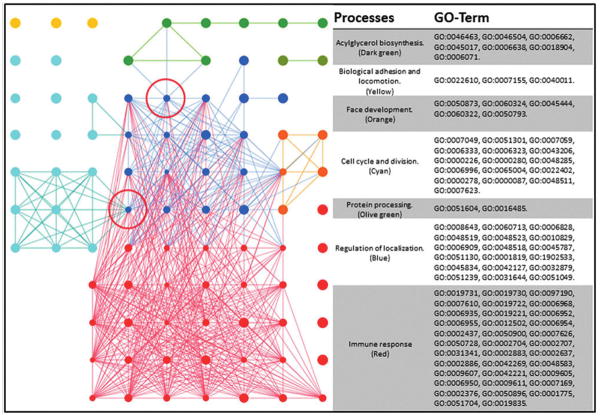
FIG. 3.
Dams-BP interaction map. GO terms processed through REVIGO are visualized through Cytoscape. Node sizes are correlated to the “uniqueness” value determined by REVIGO, where smaller nodes share more similarity with neighboring GO terms. The red circle indicates bottleneck between the “cell cycle and division” cluster and the larger and more heavily interlinked “immune system.” A bottle neck also connects “Acylglycerol biosynthesis” pathways with “Regulation of localization.”

