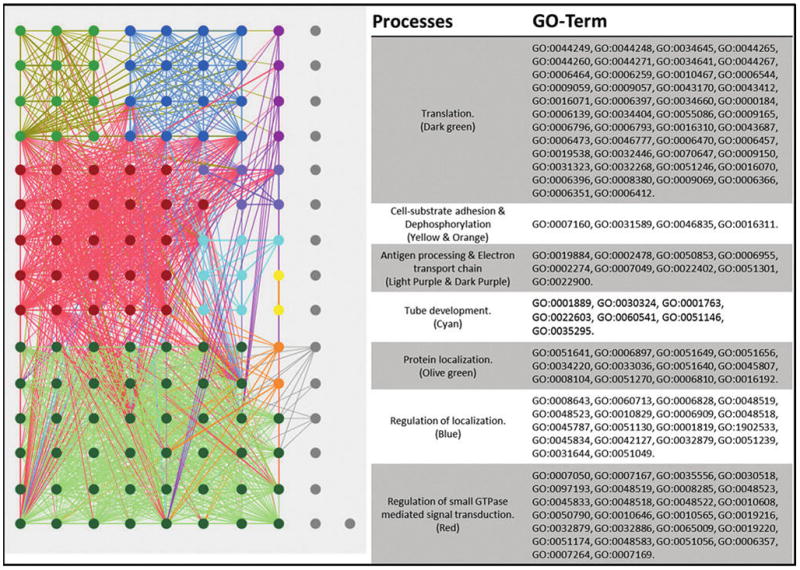
FIG. 4.

Offspring-BP interaction map. GO terms processed through REVIGO are visualized through Cytoscape. Node sizes are correlated to the “uniqueness” value determined by REVIGO, where smaller nodes share more similarity with neighboring GO terms. The highly interconnecting map does not have any bottlenecks in process interaction as seen in the ELT and Dam maps. The nodes in gray show multiple smaller unlinked GO terms.
