. 2018 Dec 27;4(1):e000445. doi: 10.1136/bmjsem-2018-000445
© Author(s) (or their employer(s)) 2018. Re-use permitted under CC BY-NC. No commercial re-use. See rights and permissions. Published by BMJ.
This is an open access article distributed in accordance with the Creative Commons Attribution Non Commercial (CC BY-NC 4.0) license, which permits others to distribute, remix, adapt, build upon this work non-commercially, and license their derivative works on different terms, provided the original work is properly cited, appropriate credit is given, any changes made indicated, and the use is non-commercial. See: http://creativecommons.org/licenses/by-nc/4.0/
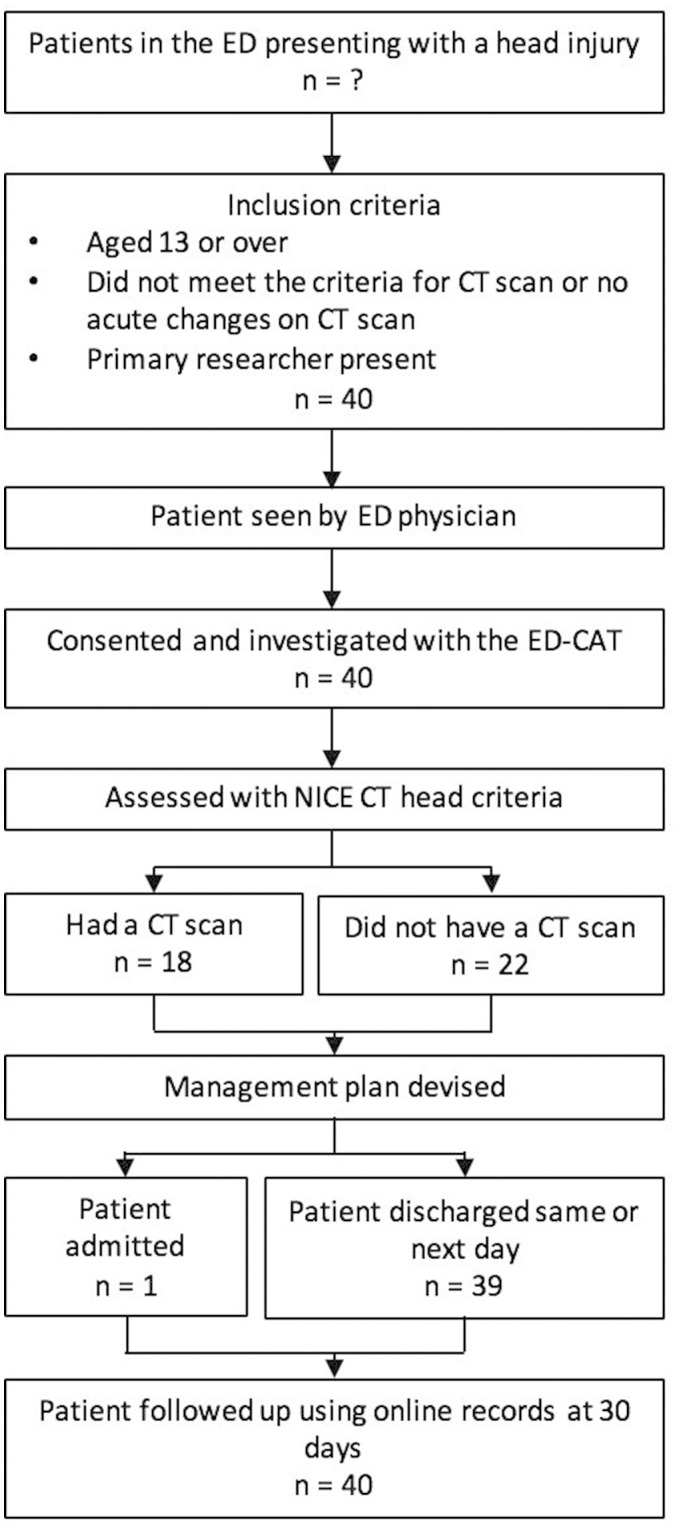
Figure 1.

Flow chart showing the methodology of the study.
