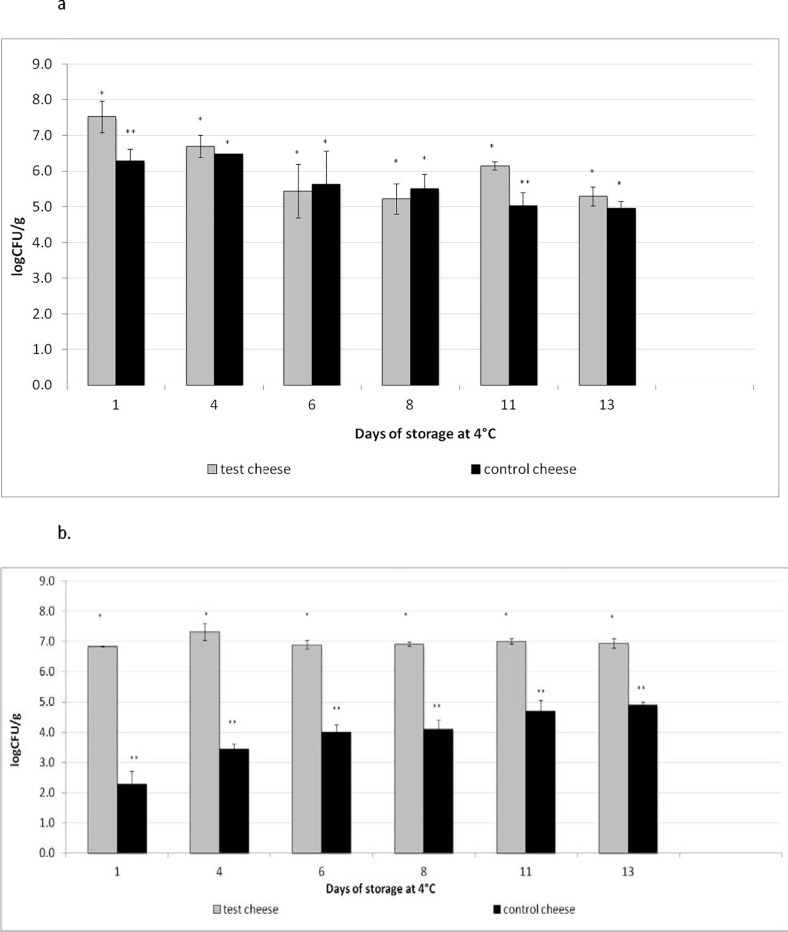
Fig 1.
Evolution of Streptococcus thermophilus (a) and Lactobacillus population (b) concentrations in test and control Squacquerone cheese during the refrigerated storage (1, 4, 6, 8, 11, 13 days). Cell loads are expressed as mean Log CFU/g cheese ± standard deviation. Control and test cheese cell loads were statistically compared at each sampling time. Comparing the same day of sampling, cell loads values of test and control cheeses having different symbols are significant different (p <0.05).

