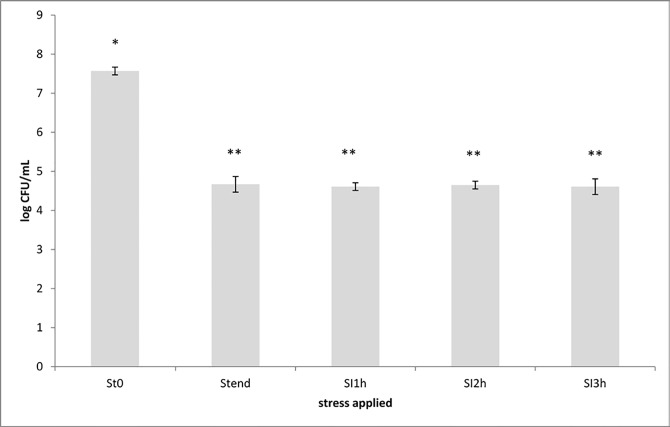
Fig 7. Evolution of Lactobacillus population cell loads in test Squacquerone cheese subjected to the Simulator of the Human Intestinal Microbial Ecosystem (SHIME).
Plate counts were carried out before (ST0) and after (STend) the stomach condition exposure, and after 1 (SI1), 2 (SI2) and 3 (SI3) h of exposure to the small intestine conditions. Cell loads are expressed as mean Log CFU/mL cheese ± standard deviation. Cell loads values having different symbol are significant different for Lactobacilli population cell loads (p <0.05).

