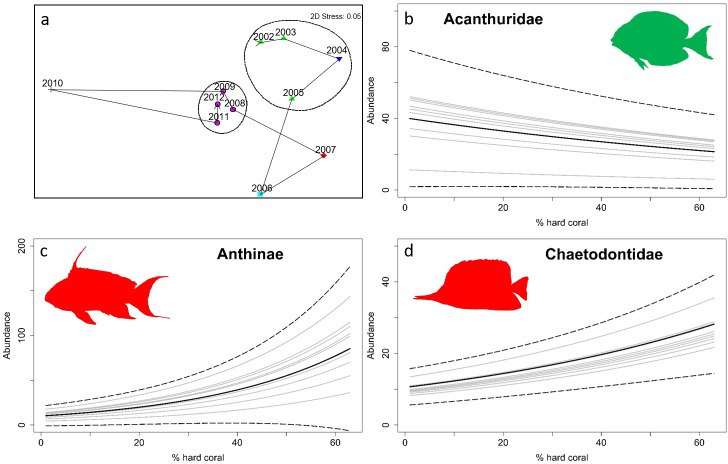
Fig 3.
a) MDS ordination plot with years sequentially connected by an arrow. Different colours and shapes represent years classified by the Simprof routine as statistically significant year groups. The circles represent a similarity level of 50%; b, c & d) Zero-inflated negative binomial generalized linear mixed effect models fitted to the relationship between abundance and hard coral cover for each year separately (solid grey lines) and mean of all years (solid black line), and confidence intervals of the mean (dashed black lines) for Acanthuridae, Anthiinae, Chaetodontidae, respectively. (Graphical representations of b, c & d families based on particularly strong and ecologically significant relationships with hard coral cover, those of all other families available in S3 and S4 Figs).

