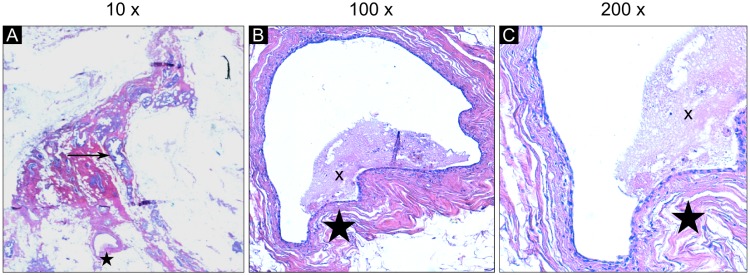
Fig 3. Histopathologic slices of sample 2 in different magnifications.
(A) In 10-fold magnification, the details of the duct marked by the asterisk cannot be visualized. This duct is the same as depicted in the histology image in Fig 2C labeled by the ‘d’. The arrow shows an exemplary DCIS structure. (B) The 100-fold magnification visualizes the normal epithelial structure. The lumen of the ducts is partially filled by debris labeled by the ‘x’. (C) The 200-fold magnification displays the epithelial monolayer in the duct in further detail.

