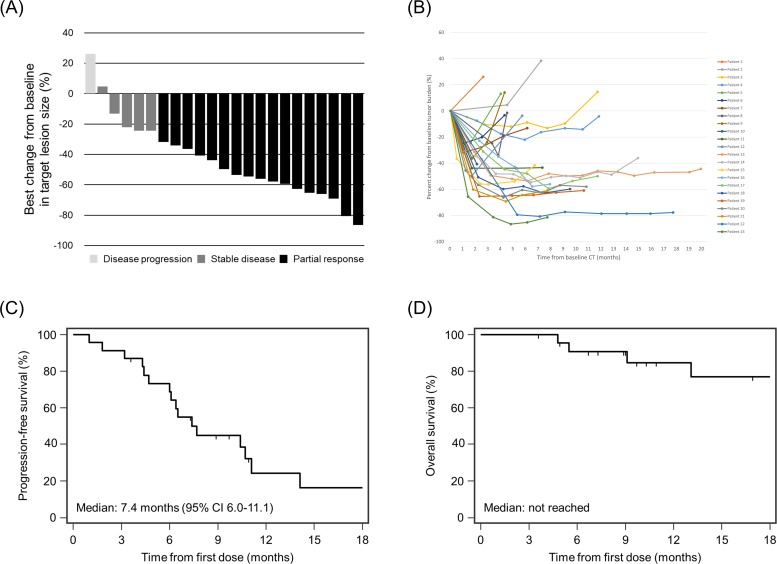
Fig 2. Response to osimertinib by RECIST 1.1 in real-world practice.
(A) Waterfall plot of best percentage changes in target lesion size. (B) Spider web graph showing the percent change from baseline in the tumor burden. (C) Kaplan-Meier analysis of progression-free survival. (D) Kaplan-Meier analysis of overall survival. Abbreviations: CI, confidence interval; CT, computed tomography.

