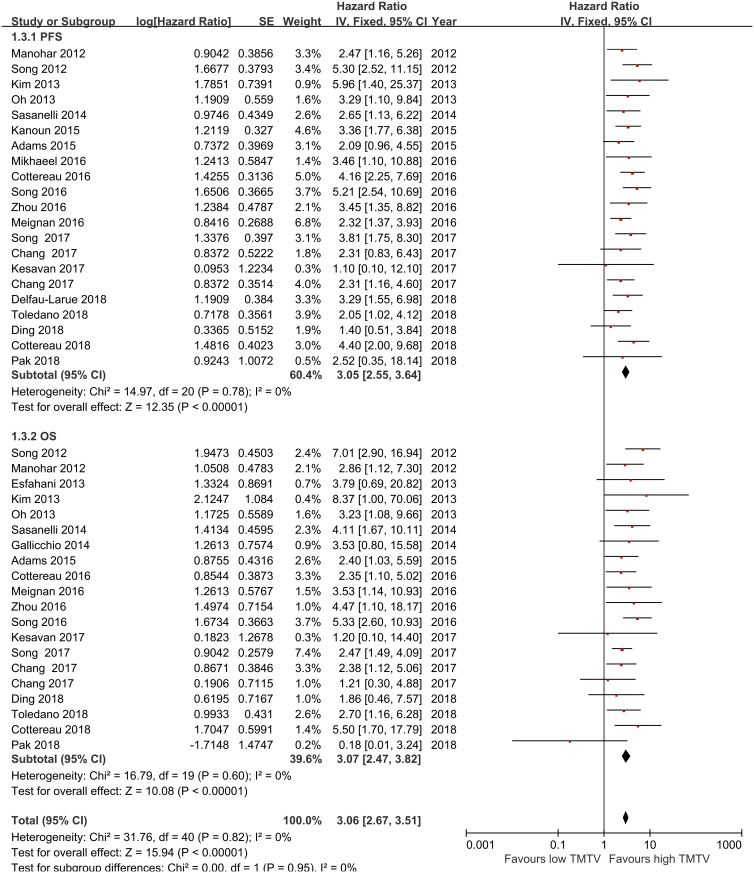
Fig 2. Meta-analysis of the hazard ratios for PFS, and OS for high TMTV vs low TMTV.
Hazard ratios and 95% confidence intervals from individual studies are depicted as squares and horizontal lines, respectively. The pooled estimate is shown as a diamond shape, where the center represents the pooled HR and the horizontal borders represent the 95% CI. Hazard ratios are defined as high TMTV vs low TMTV, therefore a hazard ratio >1 represents a higher risk of death or progression associated with high TMTV. TMTV = total metabolic tumor volume, OS = overall survival, PFS = progression-free survival, CI = confidence interval.

