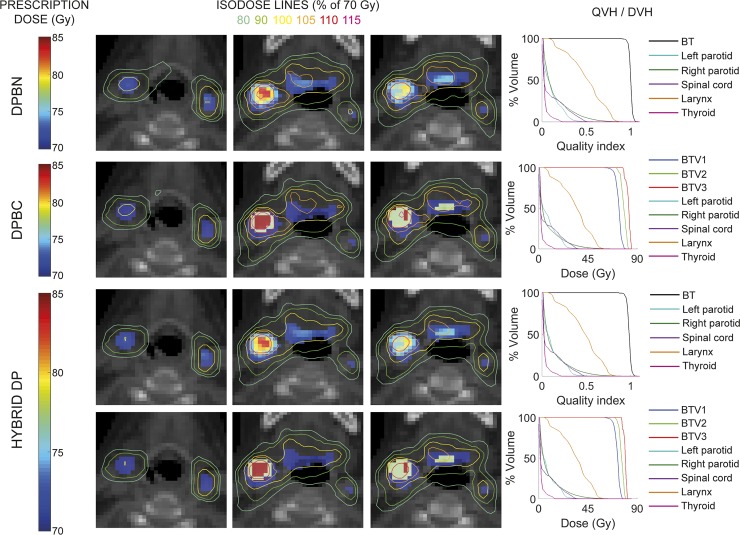
Fig 3. DPBN and DPBC plans to solve dose prescriptions based on numbers and on volumes, respectively, and HYBRID DP planning to solve both dose prescriptions.
The corresponding isodose lines show the relative dose distributions as a percentage of the minimum prescription value (70 Gy) for the three plans. The isolines are visualized over both prescription approaches on CT image. DVHs and QVHs are presented at the left for each planning solving the corresponding dose prescription.

