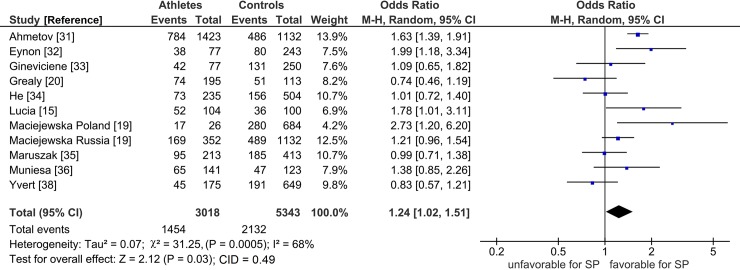
Fig 3. Forest plot outcome of PPARGC1A Gly allele effects on SP endurance in the PRO analysis.
Diamond denotes the pooled odds ratio (OR). Squares indicate the OR in each study, with square sizes directly proportional to the weight contribution (%) of each study. Horizontal lines represent 95% confidence intervals (CI). The Z test for overall effect indicates significance (P = 0.03). The χ 2 test shows presence of heterogeneity (P = 0.0005, I2 = 68%). LEGEND: M-H: Mantel-Haenszel; I2: measure of variability expressed in %; CID, confidence interval difference.

