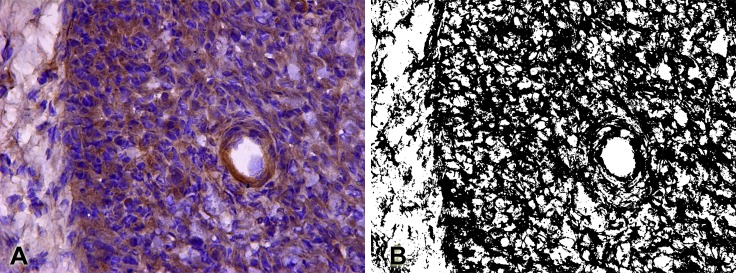
Fig 1. Semi-quantitative analysis of immunostaining.
A. Photomicrography of NGF immunolabeling, presented in brown. B. Photomicrography transformed to binary (black and white) by the "Color threshold" feature of the ImageJ software. These binary images were used for counting pixels for the semi-quantitative analysis of growth factors expressions.

