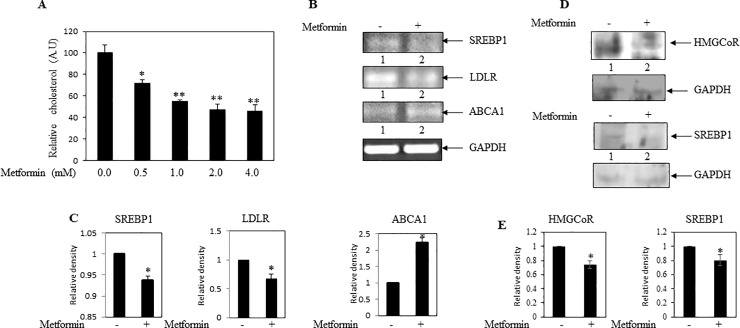
Fig 2. Effect of metformin on cellular cholesterol level and cholesterol regulatory genes in MDA-MB-231 cells.
(A) MDA-MB-231cells were treated with increasing concentrations of metformin for 24 hrs, and subsequently cholesterol level was estimated in equal number of treated and untreated cells. Bars showed relative cellular cholesterol level. Values represent mean ± SEM of triplicate measurements, *p < .05, **p<01 vs. control. (B) RT-PCR analysis was performed using gene specific primers and total RNAs isolated from metformin (2 mM) treated and untreated cells, here GAPDH was used as internal loading control (C) Bars showed the densitometry analysis (ratio of concerned gene/ internal loading control). Values represent mean ± SEM of three replicates, *p < .05 vs. control. (D) Western blot analysis was performed using total proteins of MDA-MB-231 cells treated with or without metformin (2 mM). (E) Bars showed the densitometry analysis (ratio of concerned protein/ internal loading control). Values represent mean ± SEM of three replicates, *p < .05 vs. control. A.U: arbitrary unit; A.U: arbitrary unit; HMGCoR: HMG-CoA reductase; LDLR: low density lipoprotein receptor; SREBP1: sterol regulatory element-binding protein 1; ABCA1: ATP-binding cassette transporter A1.

