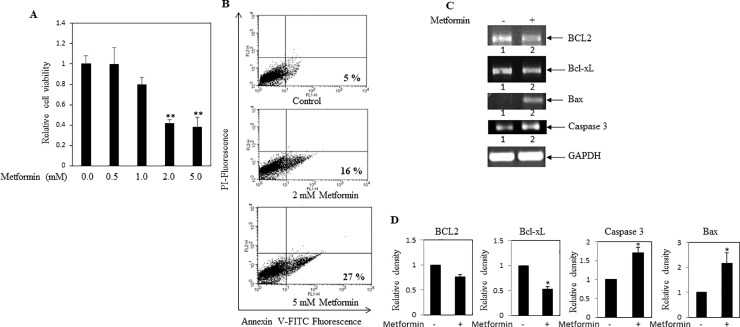
Fig 3. Influence of metformin on MDA-MB-231 cell viability.
(A) MDA-MB-231 cells were treated with various concentrations of metformin for 24 hrs. MTT assay was performed as an index of cell viability as described in methods. Values represent mean ± SEM of triplicate measurements, **p < .01 vs. control. (B) Apoptosis assay was performed as described in methods. Metformin treatment increased the apoptotic cell population as compared to control cells. Here, number of apoptotic cell population was mentioned. (C) RT-PCR analysis was performed using total RNA isolated from metformin (2 mM) treated and untreated cells, and gene specific primers. Decreased levels of anti-apoptotic markers BCL2 and Bcl-xL mRNAs were found in metformin treated cells. Elevated levels of apoptotic markers caspase3 and Bax transcripts were observed in metformin treated cells. (D) Bars showed densitometry analysis (ratio of concerned gene/ GAPDH). * p < .05 vs. control. Values represent mean ± SEM of three replicates.

