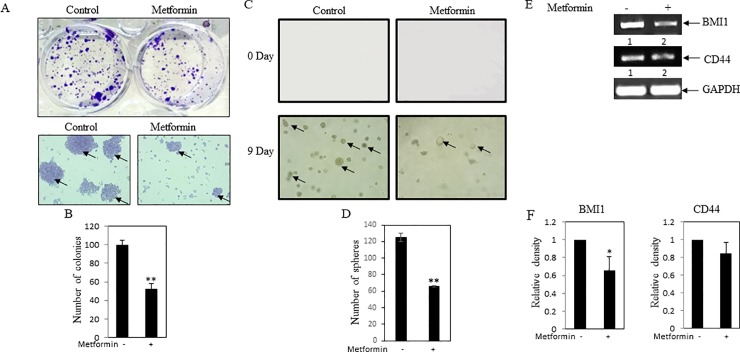
Fig 5. Influence of metformin on stemness property of cancer cells.
(A) Colony formation assay was performed. MDA-MB-231 cells were plated at low density (1000 cells/well) in 6 well plates. After 24 hrs, cells were treated with metformin (1mM). After 5 days, formed colonies were stained with crystal violet. Photos of the wells were taken by a camera (Upper panel of A). Colonies were visualized by inverted bright field microscope. Arrows depict the colonies. (B) Bars represent the average colony count of three independent fields. Value represents mean ± SEM of three replicates, **p < .01 vs. control. (C) Soft agar assay of MDA-MB-231 cells in presence and absence of metformin (1mM). Day zero and day 9 pictures were shown in the figure. Arrows depict the spheres. (D) Bars showed average of spheroid counts in three independent measurements. Value represents mean ± SEM of three replicates, **p < .01 vs. control. (E) RT-PCR analysis was performed using total RNA and gene specific primers. Decreased levels of stemness markers CD44 and BMI1 were found in metformin treated cells. GAPDH was used as internal control. (F) Bars showed the densitometry analysis (ratio of concerned gene/ GAPDH), * p < .05 vs. control. Value represents mean ± SEM of three replicates.

