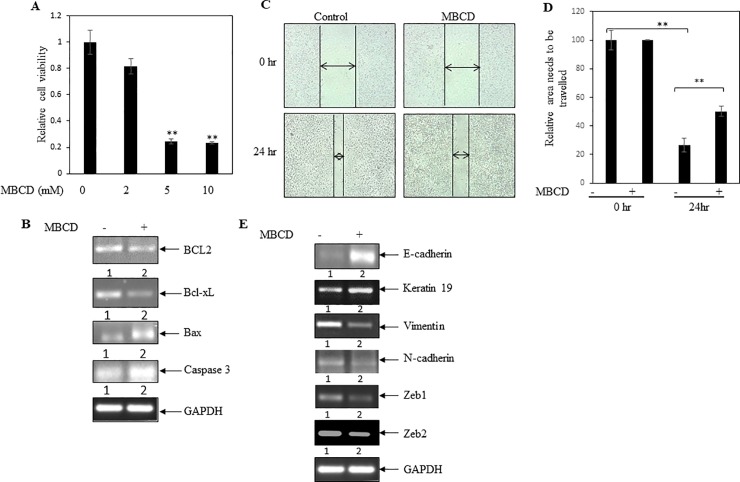
Fig 6. Effect of cholesterol depleting MBCD on breast cancer cells viability and epithelial to mesenchymal transition.
(A) MTT assay was performed. MDA-MB-231 cells were treated with various concentrations of MBCD for 24 hrs. MBCD inhibited cell viability in a dose dependent manner. Values represent mean ± SEM of triplicate measurements, **p < .01 vs. control. (B) RT-PCR analysis was performed using total RNA and gene specific primers. Decreased levels of anti-apoptotic markers BCL2 and Bcl-xL were found in MBCD (4mM) treated cells. On the other hand, elevated level of apoptotic markers caspase 3 and Bax were observed in MBCD treated cells. Densitometry analysis was shown in S1A Fig. (C) Scratch assay was performed. MDA-MB-231 cell monolayers were scratched and incubated with MBCD (2mM) for 24 hrs. After the incubation, the cell monolayers were photographed and represented photos at 0 hr and 24 hr for both control and MBCD-treated cells were shown here. (D) The unfilled gap areas between two ends of the scratch were measured and subsequently plotted. Significant inhibition of cell migration was observed in case of MBCD treated well as compared to control. Values represent mean ± SEM of triplicate measurements, **p < .01 vs. control at 0 hr. and **p < .01 vs. control at 24 hr. (E) RT-PCR analysis was performed using gene specific primers and total RNAs isolated from MBCD treated and untreated cells. Increased levels of epithelial markers E-cadherin and Keratin 19 were seen in MBCD treated cells. On the other hand, decreased expression of mesenchymal markers vimentin and N-cadherin, and decreased expression of transcription factors Zeb1 and Zeb2 were found in MBCD treated cells. Densitometry analysis was shown in S1B Fig.

