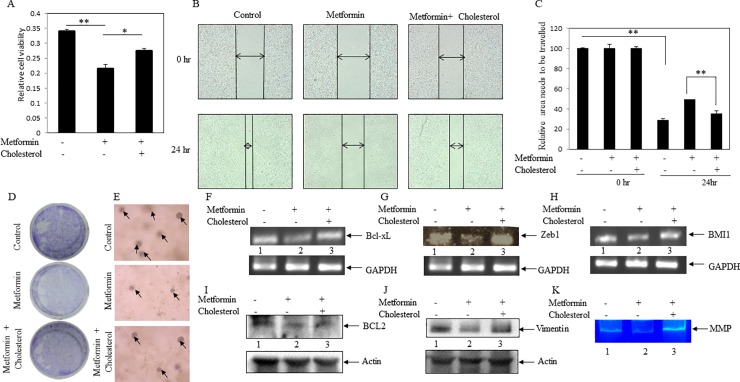
Fig 8. Cholesterol reversed metformin-mediated anticancer potential.
Cells were treated with metformin (2 mM) alone and in combination with metformin (2 mM) plus cholesterol (10 μg/ml). (A) Cell viability (MTT) assay was performed to check the reverse effect of cholesterol on metformin- inhibited cell viability. Bars are representing the relative cell viability after 24 hr of treatment. Values represent mean ± SEM of triplicate measurements, **p < .001 vs. control and *p < .001 vs. metformin. (B) Scratch assay was performed. MDA-MB-231 cell monolayers were scratched and incubated with metformin (2 mM) alone and in combination with metformin (2 mM) plus cholesterol (10 μg/ml). The cell monolayers were photographed, and represented photos at 0 hr and 24 hr for control, metformin and metformin plus cholesterol cells were shown here. (C) The unfilled gap areas between two ends of the scratch were measured and subsequently plotted. Values represent mean ± SEM of triplicate measurements, **p < .01 vs. control at 0 hr and **p < .01 vs. metformin at 24 hr. (D) Colony formation assay was performed. After 24 hr of cell seeding, cells were treated with metformin (1mM) alone and in combination with metformin (1mM) plus cholesterol (5 μg/ml). After 5 days, formed colonies were stained with crystal violet. Photos of the wells were taken by a camera. (E) Soft agar assay of MDA-MB-231 cells in presence and absence of metformin (1mM) alone and in combination with metformin (1mM) plus cholesterol (5 μg/ml). Day 9 pictures were shown in the figure. Arrows depict the spheres. (F, G and H) RT-PCR analysis was performed using total RNA isolated from metformin, metformin (1mM) plus cholesterol treated and untreated cells, and gene specific primers. Cholesterol treatment reverses the metformin inhibited genes expressions (Bcl-xL [F], Zeb1 [G] and BMI1 [H]) (compare lane 2 vs. lane 3). (I and J) Western blot analysis was performed using total proteins from metformin, metformin (1mM) plus cholesterol treated and untreated cells, and specific antibodies. Cholesterol treatment reverses the metformin inhibited genes expression (BCL2 [I] and vimentin [J]) (compare lane 2 vs. lane 3). (K) Gelatin zymography was performed using equal amount of conditioned medium of metformin, metformin (2 mM) plus cholesterol (10 μg/ml) treated and untreated cells. Metformin-inhibited MMP activity was increased by treatment of cholesterol (compare lane 2 vs. lane 3).

