
Figure 7.
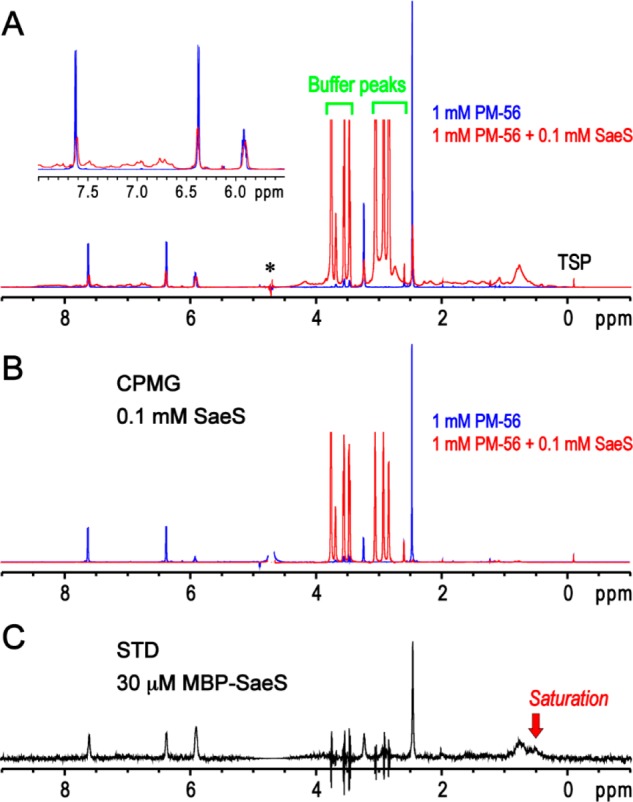
One-dimensional NMR analysis of the PM-56 binding to SaeS. (A) One-dimensional spectrum of PM-56 alone is used as a blank reference (blue). The several peaks of PM-56 are not shown in the spectrum due to an overlap with the huge water peak (marked with an asterisk). The presence of 0.1 mM of the minimal kinase domain of SaeS apparently decreases and broadens the peaks of PM-56 (red), and the peak shift of aromatic and olefin protons is also noted (inset). (B) Transverse relaxation filter using 200 ms CPMG pulse trains completely eliminated the peaks of PM-56 in the presence of 0.1 mM of the minimal kinase domain of SaeS (red). However, the reduction of the PM-56 peaks by the CPMG filter is not apparent in the absence of SaeS (blue). (C) Presence of a binding exchange process between PM-56 and MBP-SaeS is clearly confirmed by 1D STD experiment. The PM-56 peaks are specifically identified in 1D STD spectrum in the presence of 30 μM MBP-SaeS. Although the peak spikes of the remaining buffer (HEPES) are identified, their integrations are zero; slightly different peak shapes between on- and off-saturation at 0.5 and 30 ppm, respectively, could result in these peak spikes.