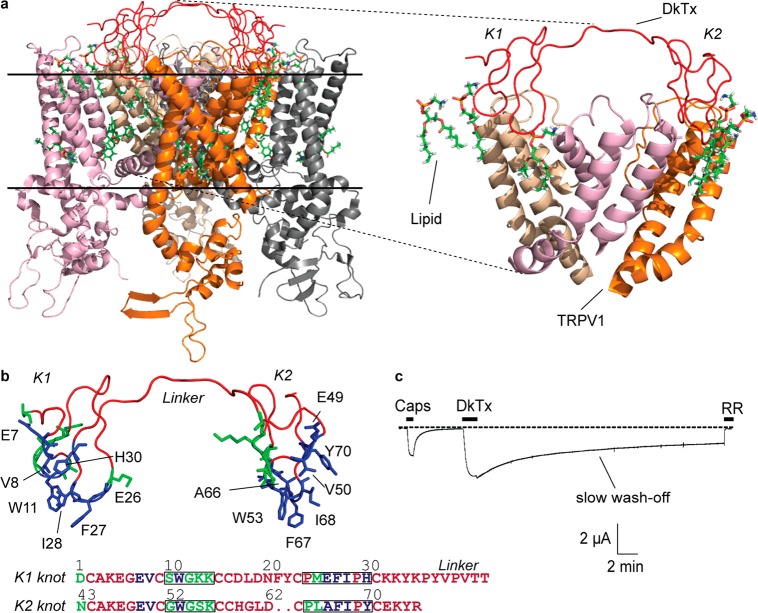
Figure 1.
DkTx–TRPV1 complex. (a) The DkTx–lipid–TRPV1 tripartite complex viewed sideways from within the membrane, PDB: 5irx,1 and a zoomed-in view of the complex depicting the pore domains of three channel monomers (right panel; the fourth monomer is not depicted to enhance clarity). The solid horizontal lines represent the membrane boundaries (the region above the top line is extracellular, and the region below the bottom line is intracellular). (b) Structure of DkTx depicting residues that interact exclusively with TRPV1 residues and not with lipids in green and those that interact with lipids in blue. Only the lipid-interacting residues are labeled. The same color code is used to denote the sequence of the K1 and K2 knots of DkTx at the bottom. The residues of loops 2 and 4 of each knot are boxed. (c) A two-electrode voltage clamp electrophysiology recording of TRPV1 depicting activation by capsaicin (Caps, 5 μM) and subsequently by DkTx (3.3 μM), followed by wash-off for 30 min, and ultimately complete channel block by ruthenium red (RR, 7 μM). The dotted line represents zero current.

