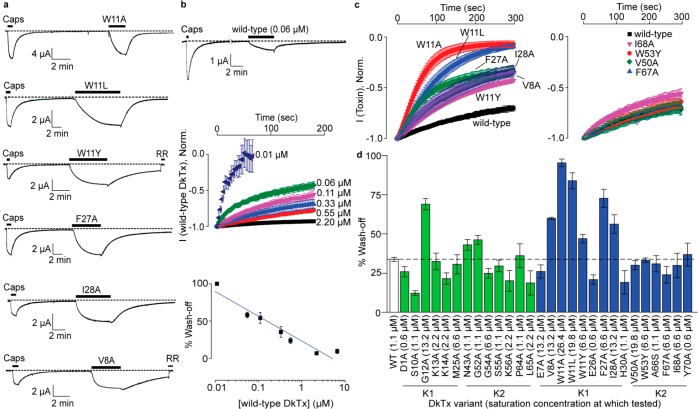
Figure 3.
Toxin wash-off studies. (a) Electrophysiological recordings obtained for fast washing-off DkTx variants. Capsaicin was applied at a concentration of 5 μM, and the toxins were applied at 6.6 μM, except for V8A, which was tested at 13.2 μM. (b) Wash-off studies on wild-type DkTx showing fast wash-off when applied at a low concentration (top panel) and concentration dependence of wash-off kinetics (middle and bottom panels). The y axis of the plot on the bottom panel depicts % reduction in current after 3 min of buffer perfusion post wild-type DkTx-mediated channel activation. The blue line shown was generated by fitting a linear equation to the data. (c) Averaged wash-off current traces obtained for wild-type DkTx and fast washing-off lipid-interacting K1 variants of DkTx (left panel) and those of their corresponding K2 variants (right panel). (d) Bar graph depicting the percentage reduction in current after 3 min of buffer perfusion post-toxin-mediated channel activation for all variants (bars corresponding to the variants of lipid-independent channel-interacting residues are depicted in green and those for lipid-interacting residues are depicted in blue). The experiments (in both c and d) were performed at saturation concentrations of the respective toxins denoted within parentheses in Figure 3d. Each current trace/data point is an average of three to five recordings, and the error bars correspond to standard deviation values.

