Figure 4.
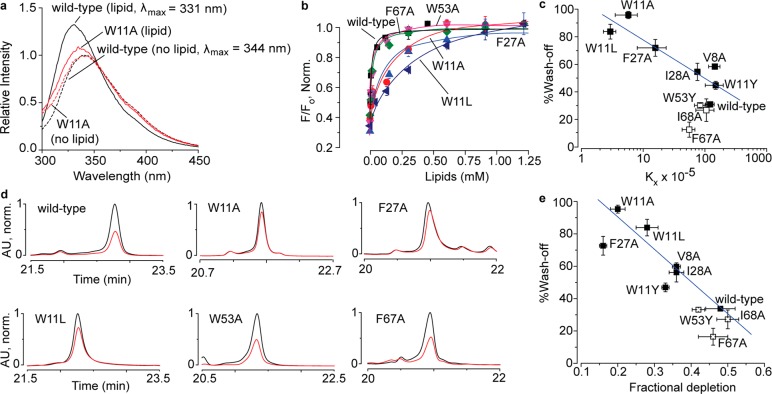
Toxin–membrane interaction studies on DkTx and its variants by employing tryptophan fluorescence (a–c) and oocyte depletion (d,e). (a) Tryptophan emission spectra of wild-type DkTx (black) and the W11A variant (red) in the presence of 1:1 POPC–POPG liposomes (total lipid concentration: 0.1 mM) have been depicted as solid curves, whereas the ones obtained in the absence of lipids are shown as dashed curves. (b) Plots of normalized relative fluorescence intensity (F/Fo) at 320 nm for the wild-type toxin and the variants of analogous phenylalanine and tryptophan residues of the K1 and K2 knots as a function of the available lipid concentration. (c) Plot of % wash-off of wild-type DkTx and K1 variants (solid squares), and those of K2 variants (open squares) after 3 min of buffer perfusion post TRPV1 activation by saturation concentrations of the toxins (obtained from the electrophysiology experiments) versus mol. fraction partitioning coefficients (Kx) values (obtained from the tryptophan fluorescence experiments). The blue line shown was generated by fitting a linear equation to the data for the K1 variants. (d) HPLC traces depicting toxin depletion upon incubation of DkTx and its variants with Xenopus laevis oocytes. Traces in black correspond to the controls wherein the toxins solubilized in buffer devoid of oocytes were subjected to HPLC analysis, whereas those in red were obtained when the supernatants of toxin solutions incubated with 100 oocytes were subjected to HPLC. (e) Plot of % wash-off of wild-type DkTx and K1 variants (solid squares) and K2 variants (open squares) after 3 min of buffer perfusion post TRPV1 activation by saturation concentrations of the toxins (obtained from the electrophysiology experiments) versus fractional depletion (obtained from HPLC peak areas as described in the Supporting Information section). The blue line shown was generated by fitting a linear equation to the data for the K1 variants. Each data point is an average of three to five recordings/assays, and the error bars correspond to standard deviation values.

