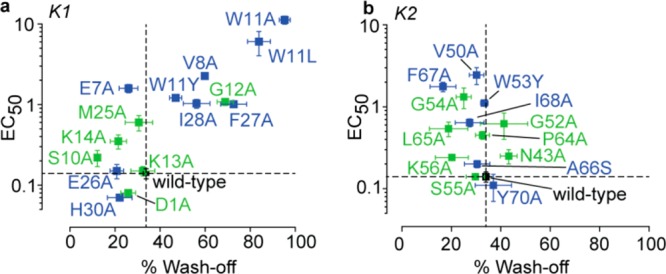
Figure 5.

Plots of potency for TRPV1 activation (EC50 values) versus channel-dissociation rates (% wash-off), of DkTx variants. (a) DkTx variants of the K1 knot residues and (b) those of the K2 knot residues. Data points for the variants of lipid-interacting residues are depicted in blue, those of channel-interacting residues in green, and that for the wild-type toxin in black. Percentage wash-off depicts the % reduction in current after 3 min of buffer perfusion post channel activation with saturation concentrations of the toxin variants. The dotted lines represent the data for wild-type DkTx.
