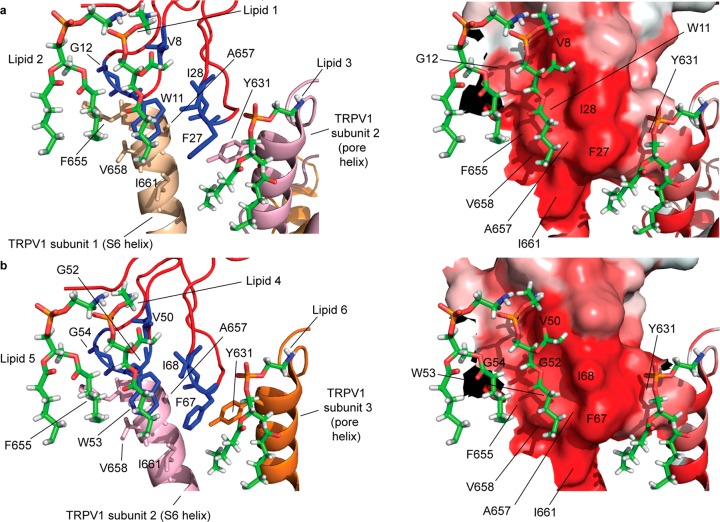
Figure 6.
Functionally critical toxin residues of the (a) K1 knot and (b) K2 knot, identified in this study mapped onto the structure (pdb: 5irx(1)) along with the TRPV1 residues and lipid molecules they interact with. The left panels depict the toxin residues in blue, the lipids in the sticks representation, and the channel residues in the color employed to depict the channel subunit they belong to (the color scheme used to render the channel subunits is the same one that was used in Figure 1). The right panels depict the same interface shown on the left panel in the surface orientation rendered by employing the Eisenberg scale, wherein the intensity of the red color is proportional to the hydrophobicity.

