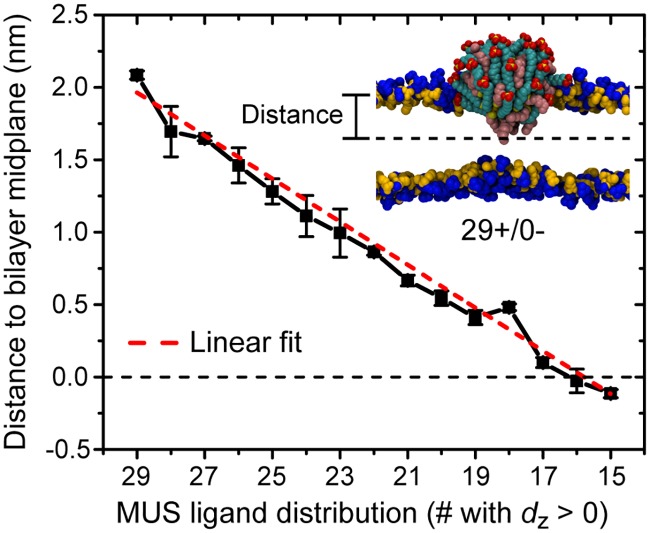
Fig 3. Distance between the center of the NP gold core and the bilayer midplane as a function of the distribution of MUS ligands.
The distance is projected along the z-axis of the system as illustrated in the accompanying snapshot; the horizontal dashed line indicates the bilayer midplane. The dashed red line is a linear fit to the data.

