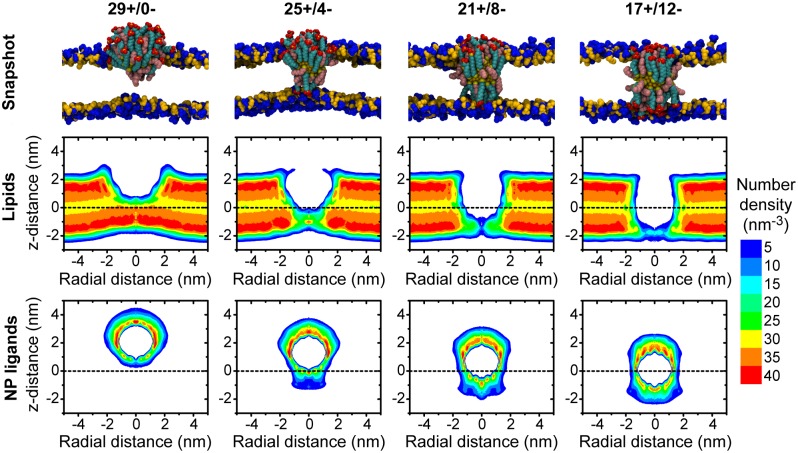
Fig 4. Configurations of lipids and NP ligands for different MUS ligand distributions.
The top row presents representative simulation snapshots of the NP and lipid head groups for four MUS distributions; lipid tail groups, water molecules, and ions are not shown. The middle row presents the time-averaged number density of all lipid atoms. The bottom row presents the time-averaged number density of all ligand atoms, including both MUS and OT ligands. Due to the cylindrical symmetry of the system, number densities are plotted as a function of the distance in the x-y plane from the center of the NP gold core (radial distance) and the distance along the z-axis from the bilayer midplane (z-distance). Positive and negative values of the radial distance are equivalent and negative values are included only as a visual aid.

