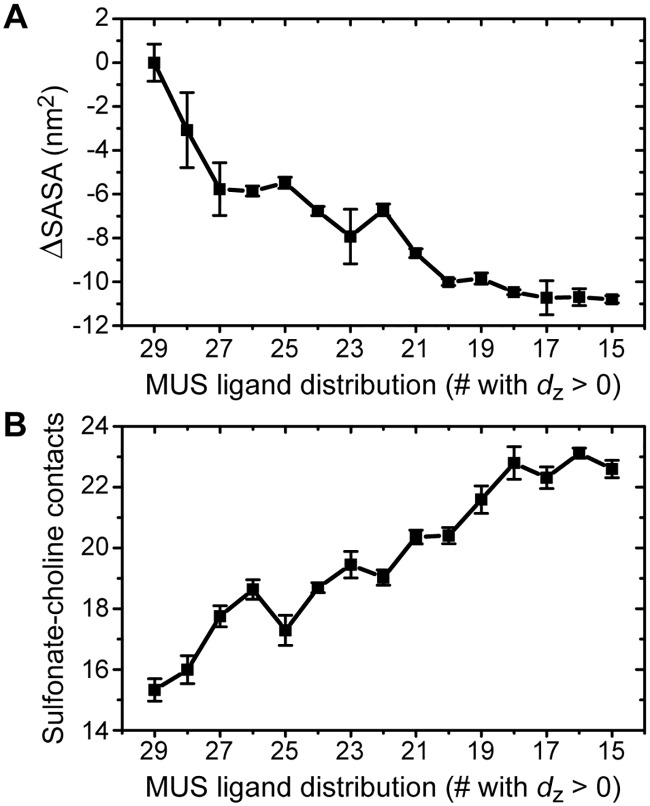
Fig 5. NP-bilayer interactions as a function of the distribution of MUS ligands.
A: Decrease in the nonpolar solvent-accessible surface area of the NP ligands. B: Increase in the number of sulfonate-choline contacts. For both plots, error bars are computed using block averaging; error bars not visible are smaller than the symbols.

