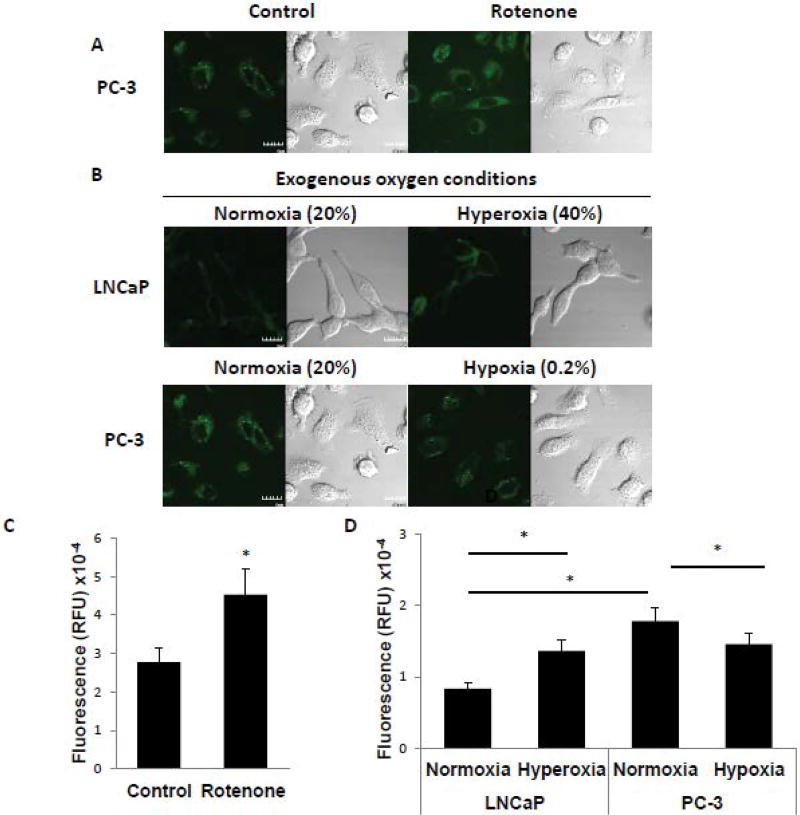
Figure 4. Mitochondrial oxygen concentration regulates generation of hydroxyl radical.
(A) Measurement of hydroxyl radical level by HPF in PC-3 cells in the absence or presence of 2 µM of rotenone added for 6 h. The green signal indicates HPF fluorescence and the corresponding image of whole cells is shown by DIC microscopy. Scale bar indicates 10µm. (B) Detection of hydroxyl radical level by HPF in LNCaP and PC-3 cells under various oxygen conditions for 6 h. LNCaP cells were incubated in exogenous normoxic (20% O2) or hyperoxic (40% O2) conditions. PC-3 cells were incubated in exogenous normoxic (20% O2) or hypoxic (0.2% O2) conditions. The green signal indicates HPF fluorescence and the corresponding image of whole cells is shown by DIC microscopy. Scale bar indicates 10µm. (C, D) Quantitation of HPF fluorescence from panel A and panel B, respectively. Data were derived from the examination of 10 cells/condition and are shown as mean ± S.D. * p<0.001.

