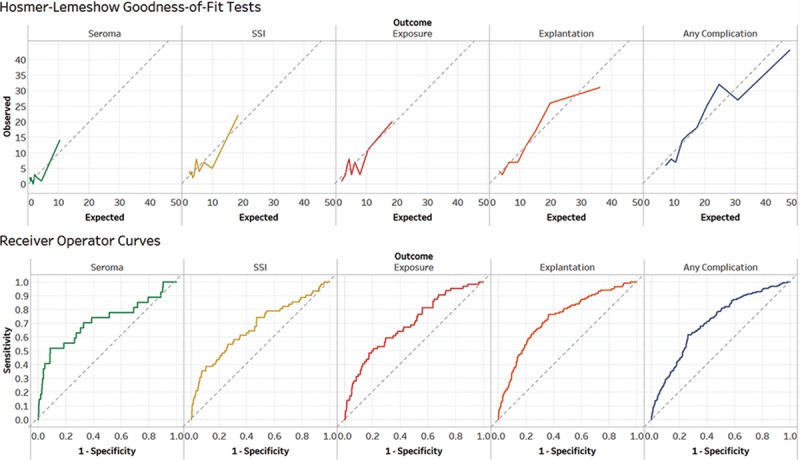
Fig. 3.

Graphical representation of H-L goodness-of-fit test and C-statistics (equivalent to the area under the receiver-operator curve). Charting expected vs observed rates of complications demonstrated good agreement between number of predicted and observed events. Indeed, the H-L tests for each model were nonsignificant (ie, greater than 0.05), indicating minimal deviation from the diagonal reference line of perfect agreement (dotted gray). C-statistics ranged from 0.674 for infection to 0.739 for explantation, indicating good discrimination or ability to distinguish high- and low- risk patients.
