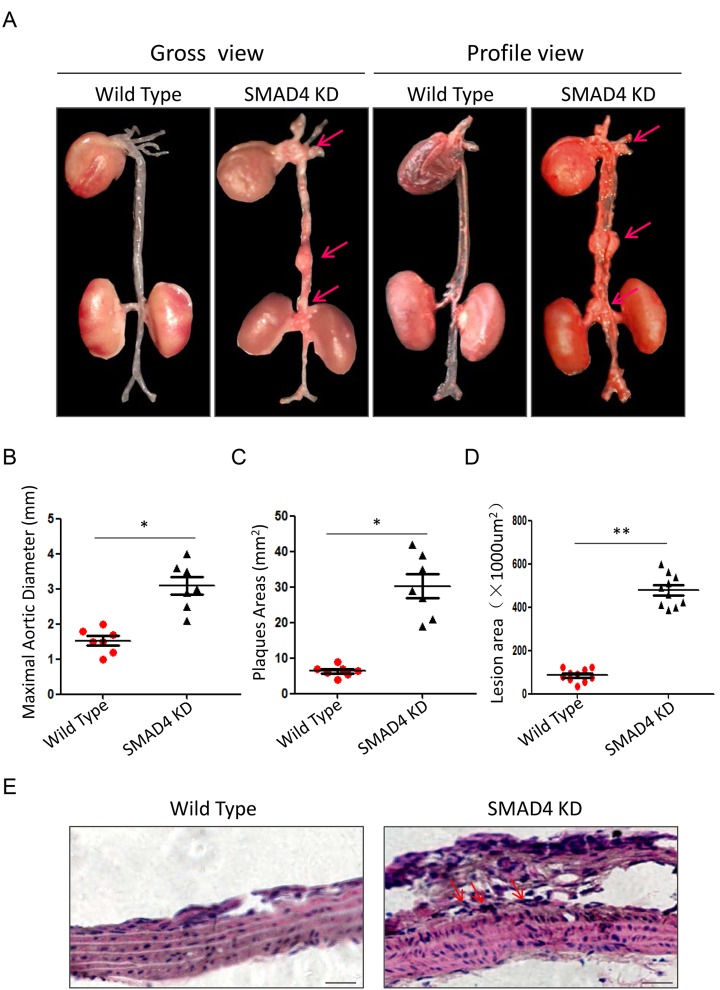
Figure 8.
Repression of SMAD4 promotes the formation of TAAD. (A) The gross view and profile view of aortas from Wild Type and SMAD4 KD mouse models. Quantitative analysis of maximal aortic diameter (B), plaques area (C) and lesion area (D) between different groups, n=5/group; (E) Representative graphs of HE staining for thoracic aortas from Wild Type and SMAD4 KD mouse models. Data are means ± SD. *P<0.05, **P<0.01. Scale bars: 100μm.

