
Figure 2.
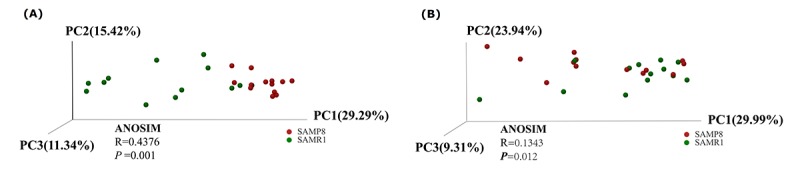
Principal Coordinates Analysis of (A) unweighted and (B) weighted UniFrac distances for SAMR1 and SAMP8. The red circles represent the SAMP8 mice (n = 13) and green circles represent SAMR1 mice (n = 13). PC1, PC2 and PC3 represent the top three principal coordinates that captured the maximum diversity.