
Figure 3.
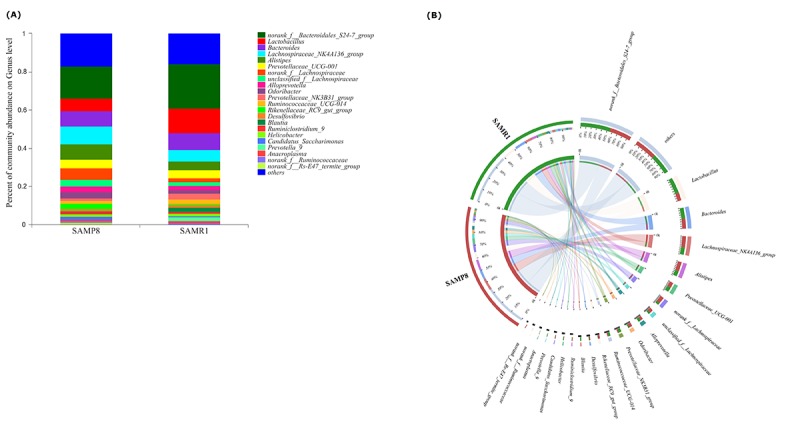
Relative abundance of microbial community for each group at genus level. (A) Bar-plot analysis shows the average relative abundance of fecal microbiota in each group. (B) Circos analysis displays the corresponding abundance relationship between samples and bacterial communities.